
 |
| Our data...a little blurry from the IWB. |
I tried this idea recently with my maths class for creating a pie chart. We used sentence strips to create a pie chart. For our example, it worked out that we were teaching fractions and
graphing simultaneously and so we used data from our "Smarties"
fractions activity to create a pie chart to represent that data.
The total number of Smarties was 40, so we began by dividing our sentence strip into 40 even pieces. Each piece was the width of our ruler.
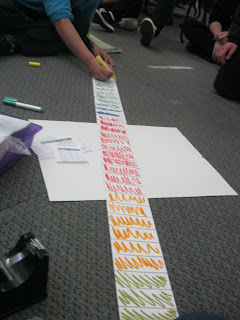
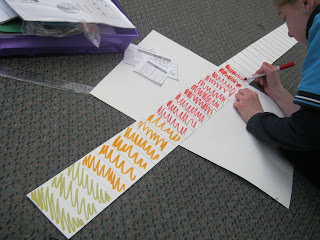
 Next, we coloured in the amount of each part of the pie chart. Thus, three pieces of the sentence strip were coloured brown to represent the three brown Smarties, six pieces coloured orange to represent the orange Smarties and so on.
The next step was to create our pie chart by putting the ends of the sentence strip together. The smaller the sentence strip, the easier this is so we had to get a little creative to keep the ends together.
Once the ends were together, we place our circle onto paper to trace our pie chart.
 And finally, we used a ruler to create the divisions of the pie chart on our paper. A fun and creative way to create a pie chart! This is also a concrete way of creating pie charts. Following the Concrete-Pictorial-Abstract theory, we then moved on to creating pie charts on paper and then abstractly.


 Next, we coloured in the amount of each part of the pie chart. Thus, three pieces of the sentence strip were coloured brown to represent the three brown Smarties, six pieces coloured orange to represent the orange Smarties and so on.
The next step was to create our pie chart by putting the ends of the sentence strip together. The smaller the sentence strip, the easier this is so we had to get a little creative to keep the ends together.
Once the ends were together, we place our circle onto paper to trace our pie chart.

No comments:
Post a Comment